Wednesday, November 16, 2011

Real Time vs Back Testing

There is a significant distinction between real time performance results and those derived from back testing.  The distinction lies in the probability that future performance will be consistent with the past results.

Real time results are predicated on using the data available at the time that the results are calculated.  Back testing often relies on data such as actual earnings (not available at the time) vs estimated earnings.

Real time also requires a logical hypothesis as the basis for the criterion selection.  Back testing often is based on correlations found in data without a supporting logical framework.

Corequity has conducted its screens in real time from the outset in 2004.

The primary criteria throughout is the Valuation Return or Risk (VR).  This is the degree to which the valuation of an equity, based on its normalized estimated earnings, is out of line with its own history of relative Payback.

Also, we included Payback rank in our screens as another criteria.  The logical assumption here was that equities with low Paybacks (equivalent to a high discount rate in a Discounted Cash Flow Model) would outperform equities which had a high Payback.

Another assumption in our screens was that Value Line Timeliness Rank would enhance the selection of under- and overvalued equities.

Finally, in 2005 we introduced a measure to enhance probability that the VR was correct by using  the ratio of Estimated Earnings (EPS) divided by Normalized Earnings (MPEPS).  The logical assumption was that an undervalued stock with estimated earnings of X but normalized earnings of X-y would have a higher probability of success than one with X/X+y.   In the real time screens we used a cut off of 1.1 or greater for the Undervalued and .9 or less for the Overvalued.

With the benefit of our current data set of 7 years of data (46,000 records), and the ability to analyze it using Excel Pivot Tables,  it is easy to see which assumptions were correct and which were not.

Payback: We could find little advantage or disadvantage in the 7 years of data in using Payback rank as a criteria.  This suggests that the market assignment of a Payback is “efficient”.

Value Line Timeliness:  This criteria significantly detracted from the Undervalued performance but proved to be of value in improving the negative results for the overvalued screen (quite dramatically). 

As shown at the very top in the 7 years graph and tables of results, what worked as hypothesized were VR and EST/MPEPS:  the spread between Undervalued and Overvalued screens was 9.2% annually
.
Therefore we would argue that the result presented are substantially derived in real time.

Tuesday, November 15, 2011

Performance Results: 7 years September '04 to September '11

The Undervalued Screens outperformed the Overvalued by 9.2% per annum for the 7 years ending in September.*

Relative to our universe,  the annualized returns were +3.2% pa vs -5.8% p.a. respectively.  Relative to the S&P 500. the returns were +5.9% and -3.3% for the seven year period.

Performance data  for other periods ending Sept 30th are show in the table below:


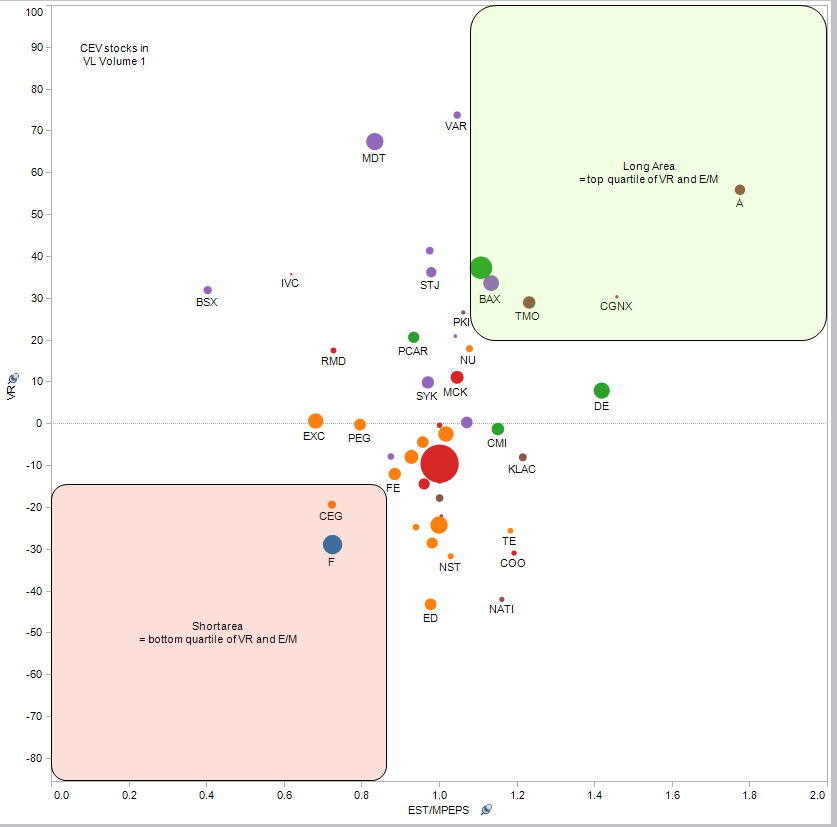
$100 invested in the both was would have been worth $150 and $79 respectively. Using only the top and bottom quartile for VR and E/M (4,4 vs 1,1) we get even larger returns and divergence. The values after seven years becomes $166 vs $68. The former screens would be closer to a portfolio returns while the latter are the buy & and sell or short lists.
                   
*  Returns are for the top bottom 2 quartiles for Valuation Return/Risk (VR) and the top and bottom quartile for E/M (the ratio of estimated earnings (EST) divided by normalized earnings (MPEPS)).  Returns exclude income and are based on linked monthly average gains or losses.                         


Some background ...

In the late 1960s Robert co-founded Marcinvest Fund, a no load equity mutual fund in Canada. As manager, he developed a valuation methodology to ascertain whether street expectations were already discounted in the stock prices. In the early seventies Marcinvest was merged with Altimira Management and Robert continued as the sole equity manager.
In 1976, he moved to Boston to sell an institutional equity valuation service (under Colby Equity Valuations, Inc.). The valuation model was computerized in order to cover a large number of equities. Its primary goal is in identifying overvalued and undervalued equities.
The institutional clients who subscribed to the service included Allied Signal, Canadian Pacific, Canadian Broadcasting, General Electric, Ontario Hospital Association and Ontario Municipal Retirement System, Choate Hall & Stewart, Fidelity International, Fiduciary Trust Company, The First Church of Christ Scientist, Gardner & Preston Moss, Harvard Management Corporation, Jarislowsky Fraser, Massachusetts Financial Services, Thorne Ernst & Whinney, United Financial Management and Wellington Management. In addition, Robert was President of Manasset Corporation, a family office in Providence, RI. Mr. Colby’s equity valuation service was re-started over 7 years ago.
Robert Colby has had extensive corporate Board experience both as board member and officer of a number of for profit and non-profit organizations. A graduate of McGill University, he maintains residences in Dedham, Ma and Georgeville, Quebec.