
Tuesday, January 15, 2013
Sunday, January 6, 2013


Thursday, December 20, 2012

Friday, December 14, 2012

Wednesday, December 12, 2012
Volume 3 - Petroleum, Natural Gas, Chemical Specialty Coal-

click here to view the file
As an example of an overvalued stock, CNX has estimated earnings of $1.10, well below normalized earnings (MPEPS) of 2.01. On the basis of the latter, the stock is overvalued by 48%. To be fairly valued it would need to earn $3.18 (IEPS). At that level it would have an implied Reinvestment Return of 17.2% vs the current Reinvestment Return of 9.7% based on MPEPS.

As an example of an overvalued stock, CNX has estimated earnings of $1.10, well below normalized earnings (MPEPS) of 2.01. On the basis of the latter, the stock is overvalued by 48%. To be fairly valued it would need to earn $3.18 (IEPS). At that level it would have an implied Reinvestment Return of 17.2% vs the current Reinvestment Return of 9.7% based on MPEPS.
The required normalized RoE to breakeven is 20% which does have precedence during the secular decline starting in 2006. The question is will it happen again in time to justify the stock price of this coal and natural gas company.
Friday, November 30, 2012
8 Years results from September 2004 to September 2012
Corequity has been conducting monthly valuation analysis of over 500 US equities since September 2004. The resulting 8 year database has over 52,000 records each averaging over 40 variables. A lot of progress has been made analyzing the data in the last few months using Excel PivotTables. A brief review of performance and some initial analysis is presented below.

This graph shows the performance of the two screens for value, the Long and the Short lists as defined by the lowest and highest VR and E/M quartiles. The Undervalued index outperforms the S&P 500 by 525 basis points per annum while the Overvalued does 262 points worse. Adjusted for the fact that the Corequity universe averaged 209 bp pa better than the S&P, the spread is +316 vs -471 or +787 bp pa.
The last twelve months have been disappointing though. A look at the individual screens over this period sheds some light on the market's preferences over this period.(See the preceding 10/2/12 comment looks at the Sector weightings of the screens. The focus here is on the investment characteristics.)
First, a look at the Undervalued Screens: they are selected on the basis of their 4th quartiles of Valuation Return/Risk and the ratio of the Estimated vs Normalized earnings (E/M). These stocks are the most undervalued using normalized earnings that are the lowest compared to their current estimate.
To view tables more easily click this link

The list is has a relatively high Reinvestment Return, moderately low Payback (PB) compared to their historical norm (NM) and reasonable growth projections as forecast by Value Line (last 5 columns).
The Overvalued list has the stocks which are most overvalued with estimated earnings that are lowest compared to their normalized earnings.

 The preference for the overvalued stocks looks like a huge bet on secular change in profitability at the expense of quality growth companies.
Robert L. Colby
Some background ...
Robert Colby has had extensive corporate Board experience both as board member and officer of a number of for profit and non-profit organizations. A graduate of McGill University, he maintains residences in Dedham, Ma and Georgeville, Quebec.

This graph shows the performance of the two screens for value, the Long and the Short lists as defined by the lowest and highest VR and E/M quartiles. The Undervalued index outperforms the S&P 500 by 525 basis points per annum while the Overvalued does 262 points worse. Adjusted for the fact that the Corequity universe averaged 209 bp pa better than the S&P, the spread is +316 vs -471 or +787 bp pa.
The last twelve months have been disappointing though. A look at the individual screens over this period sheds some light on the market's preferences over this period.(See the preceding 10/2/12 comment looks at the Sector weightings of the screens. The focus here is on the investment characteristics.)
First, a look at the Undervalued Screens: they are selected on the basis of their 4th quartiles of Valuation Return/Risk and the ratio of the Estimated vs Normalized earnings (E/M). These stocks are the most undervalued using normalized earnings that are the lowest compared to their current estimate.
To view tables more easily click this link

The list is has a relatively high Reinvestment Return, moderately low Payback (PB) compared to their historical norm (NM) and reasonable growth projections as forecast by Value Line (last 5 columns).
The Overvalued list has the stocks which are most overvalued with estimated earnings that are lowest compared to their normalized earnings.

The Overvalued show lower growth (RR), higher Payback and the Value Line growth statistics are only marginally better in two out of five measures.

Robert L. Colby
Some background ...
In the late 1960s Robert co-founded Marcinvest Fund, a no load equity mutual fund in Canada. As manager, he developed a valuation methodology to ascertain whether street expectations were already discounted in the stock prices. In the early seventies Marcinvest was merged with Altimira Management and Robert continued as the sole equity manager.
In 1976, he moved to Boston to sell an institutional equity valuation service (under Colby Equity Valuations, Inc.). The valuation model was computerized in order to cover a large number of equities. Its primary goal is in identifying overvalued and undervalued equities.
The institutional clients who subscribed to the service included Allied Signal, Canadian Pacific, Canadian Broadcasting, General Electric, Ontario Hospital Association and Ontario Municipal Retirement System, Choate Hall & Stewart, Fidelity International, Fiduciary Trust Company, The First Church of Christ Scientist, Gardner & Preston Moss, Harvard Management Corporation, Jarislowsky Fraser, Massachusetts Financial Services, Thorne Ernst & Whinney, United Financial Management and Wellington Management. In addition, Robert was President of Manasset Corporation, a family office in Providence, RI. Mr. Colby’s equity valuation service was re-started over 7 years ago.
Thursday, November 29, 2012

Monday, November 19, 2012

Sunday, November 18, 2012
Volume 13 stocks
Each week we review the stocks that we cover in the current volume of Value Line. This week is Volume 13 which covers computer, internet, financial services and banking stocks.

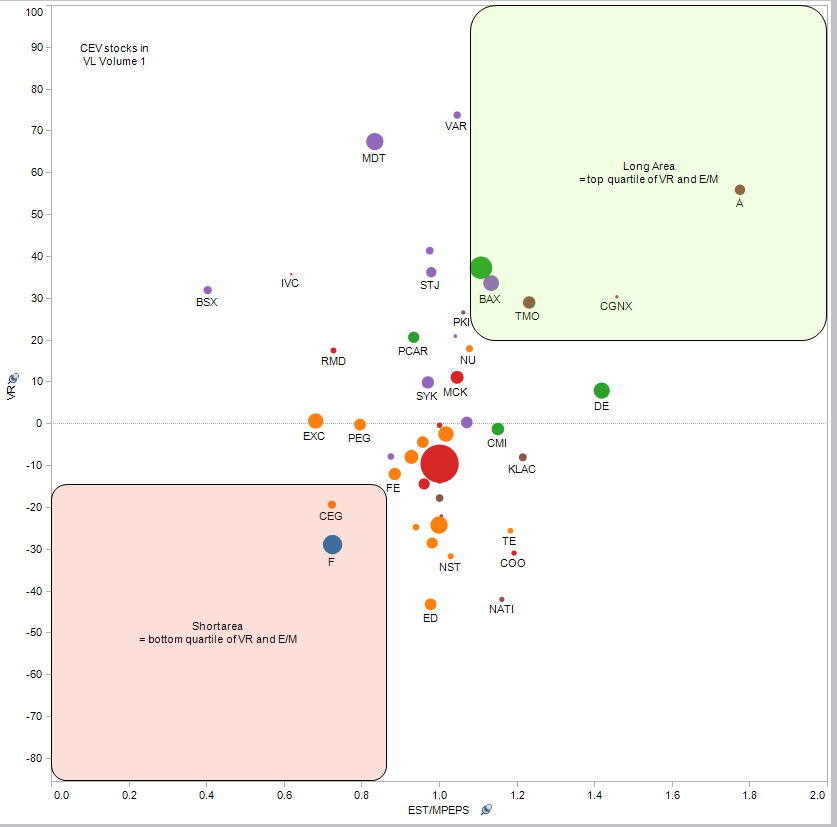
The the two most important measures are VR (Valuation Return/Risk) and E/M*. VR is the projected percent price change given the current estimate and the historical relative valuation for the individual stock using Payback. E/M is the ratio of Estimated Earnings to normalized Earnings or MPEPS. It is important that undervalued stocks have a ratio of close to or over 1.0x and vice versa.
In addition, we have included the Implied Earnings (IEPS) and its derived Reinvestment Return (ImRR). These are the numbers needed to be fairly valued and useful if you do not agree with the MPEPS number and its derived RR.
In this volume Microsoft and Yahoo stand out as attractive values. Microsoft is undervalued by 29% if its current normalized earnings of 2.95 (2013) hold and grow at 16.4%. It is fairly valued if its normalized earnings are 2.53 growing at 13.0%.
* In the 8 years ending in September of this year, the Undervalued screens (4th percentiles of VR and E/M or 4,4) out performed the Overvalued (1,1) by close to 800 basis points per annum real time.
Tuesday, October 2, 2012
September 30th 2012 Valuation Report
The best and worst values from the September 30th 2012 monthly report are examined here.

The undervalued list covers 21 stocks whose Sector representation is shown above. The list is dominated by Industrial, Technology & Consumer Cyclical stocks.
Example of the Undervalued: Harris Corp (HRS $51.22)
A good example of these stocks is Harris Corp. It had a Valuation Return (VR) of +45% based on normalized earnings (MPEPS) of $3.50 vs an estimate of $5.25 for 2013. This is illustrated in the following graph of Return on Equity (RoE).

Normalized earnings, expressed as RoE, are 10.9% ('M'). This is substantially below the estimated RoE,
but well above the earnings implied by the price of $2.77 (IEPS). The latter RoE is 8.7% ('I'), 210 basis points lower than normalized. Translated into growth (Reinvestment Return or RR), the normalized number is 7.6% whereas the implied RR is only 5.0%.
HRS has a history of trading at a premium to the market which has been consistent over the last two decades. Currently, at slight premium to the market Payback, it is cheap compared to its history.

For more details on these stocks -> The Undervalued short list 9/30/12
* * *

The overvalued stocks are more numerous and have a broader Sector representation. They are also more concentrated in one Sector, namely the CONSUMER CYCLICAL (42%) due in part to 5 stocks in the Homebuilding industry.
A good example would be D R HORTON INC (DHI $20.63) which has outperformed the market by roughly 100% in the last 12 months. Its Valuation Risk (VR) is now -69% based on its normalized earnings for next year of $1.26.

The estimate is $0.90 but the implied earnings are $2.86. In terms of RoE, normalized earnings are 14.2% ('M') vs the implied 32.1% ('I').
That is just to break even at today's price.
For more details on these stocks -> The Overvalued short list 9/30/2012
A copy of the complete September report is available to institutional investors by emailing robertlcolby@gmail.com.
Friday, June 29, 2012
Volume 6 - Homebuilding stocks
Using median values instead of averages,
Homebuilding stocks are 55% overvalued
. This assumes normalized earnings of $1.91 for
2013 vs estimated earnings of $1.10. Reinvestment Return using normalized earnings
averages 13.4%. For
these stocks to be fairly valued , they would need to average $2.76 in 2013 which would result in a Reinvestment Return or growth rate of 25.6%

Wednesday, June 20, 2012
VOLUME 5 STOCKS
Each week we update the data and analysis for 1/13 of our universe as Value Line updates their research. This week we reviewed all of the stocks in Volume 5 and the following table summarizes the results of the analysis.
On the long side Johnson Controls, Broadcom and Meritor look undervalued. On the short side Sprint Nextel and Tellabs look overvalued despite their both being stocks trading at the $3 level. Of the five, JCI and S have by far the best predictive histories.

Robert Colby
Sunday, June 10, 2012
2012 Year to Date
Despite a strong start in January and February, the screens have not performed well in the last 3 months thereby offsetting the earlier gains and then some. The buy list comprised of the 4th Quartiles for VR and E/M is off 6.5% relative to the S&P 500 while its opposite is up 7.3%. The broader lists which are referred to as long and short Porfolios are -2.0% and +5.1%.
To put this in perspective....

We are in a period where value is being created. There has been a negative correlation between Valuation Return/Risk and Relative Strength. The annualized spread since September 2004 has declined to +9.9% pa, or +6.5% & -3.4% It should be noted that the unweighted index of our universe in this period is +2.6% pa

The 'portfolio' screens have a spread of +7.3% pa comprising of +5.5 and -1.8%.
Sector Analysis
A look at the Sector breakdown of the screens since inception allows us to see where the contribution to performance (or deduction) has been coming from. For example, Technology stocks contribute an average annualized return of +15.7% to the Undervalued short list. On the other hand, Consumer-Cyclicals is -11.3% and Financial stocks are -5.1%.For the Overvalued, the Energy sector presents a major annualized offset to its negative performance: +24.0% on the short list and +14.0% to the larger portfolio list. Likewise, Technology produced a positive return of +7.2% and +4.1% respectively. The Financial Sector contributed the largest negative return of -15.9 and 7.4%
The relative contributions are shown below along with the Sectors rank.

781-742-6112
Thursday, May 3, 2012
BUY & SHORT LIST - April 30th 2012
The following table contains the screens for the best and the worst values in the April 30th valuation. Below that is a look at the Sector bets that these equities represent compared to the S&P 500 Sector weightings.


Tuesday, April 3, 2012

Wednesday, February 1, 2012
January results for the Undervalued and Overvalued Screens
The undervalued stocks had average relative performance of 7.16% vs 0.16% for the Overvalued compared to the S&P 500. It gained 4.35% so that the absolute performance of the Undervalued was 11.5%, a gain which is, sadly, unsustainable.
The Overvalued contain a huge bet against (for?) the Consumer sector and is fairly evenly divided between big cap, medium and small cap. The Undervalued is characterized by a huge bet on big cap stocks and is fairly evenly divided among 7 sectors.

Wednesday, January 11, 2012
Year end Valuations of equities, Industries and Sectors.
The image below shows the valuation of the 540 equities that we cover together with the Industries and Sectors that they represent. Attractive stocks are in the upper right hand corner with high Valuation Return and high Estimated Earnings vs Normalized earnings. (See performance results below.)

Access to an interactive version of this worksheet is available on the Tableau web site given below.
Click here to go to interactive web page
By clicking on the Sector that you are interested in, the Sector, Industry and companies are highlighted. Clicking the Sector again restores the view to the original. Also by moving the cursor over the position brings up information about the stock, industry or sector.
This sheet shows the best and worst equity values as of 12/31.

Thursday, January 5, 2012
2011 Results for the Under- and Overvalued Screens
The spread between the Undervalued and Overvalued Screens* was larger than usual in 2011. For the year, it was +16.64% due primarily to the poor performance of the Overvalued. The Undervalued had a mixed year with good results in the 1st half with poor results in the 3rd Quarter and an ok 4th Quarter. The Overvalued did very poorly in the first 3 quarters and came back 5 1/2 % in the 4th.

For the 7.25 years since inception the returns are +6.16% pa and -2.53% pa relative to the S&P 500 for a spread of +8.69% pa. Relative to our universe the relative returns are +3.21% and -5.23% pa respectively.
* The criteria for the Undervalued screens are 3rd & 4th Quartile Valuation Return and 4th Quartile of E/M. The Overvalued are the mirror opposite. This is explained with the seven year record to September 2011 is shown below.
Thursday, December 1, 2011
November 30th Screens for Under- and Overvalued equities
Based on last night's close the following tables summarizes the equities in Quadrant 4 for VR & E/M (Undervalued) and Quadrant 1 for VR & E/M (Overvalued).


Wednesday, November 23, 2011
Wednesday, November 16, 2011
Real Time vs Back Testing
There is a significant distinction between real time performance results and those derived from back testing. The distinction lies in the probability that future performance will be consistent with the past results.
Real time results are predicated on using the data available at the time that the results are calculated. Back testing often relies on data such as actual earnings (not available at the time) vs estimated earnings.
Real time also requires a logical hypothesis as the basis for the criterion selection. Back testing often is based on correlations found in data without a supporting logical framework.
Corequity has conducted its screens in real time from the outset in 2004.
The primary criteria throughout is the Valuation Return or Risk (VR). This is the degree to which the valuation of an equity, based on its normalized estimated earnings, is out of line with its own history of relative Payback.
Also, we included Payback rank in our screens as another criteria. The logical assumption here was that equities with low Paybacks (equivalent to a high discount rate in a Discounted Cash Flow Model) would outperform equities which had a high Payback.
Another assumption in our screens was that Value Line Timeliness Rank would enhance the selection of under- and overvalued equities.
Finally, in 2005 we introduced a measure to enhance probability that the VR was correct by using the ratio of Estimated Earnings (EPS) divided by Normalized Earnings (MPEPS). The logical assumption was that an undervalued stock with estimated earnings of X but normalized earnings of X-y would have a higher probability of success than one with X/X+y. In the real time screens we used a cut off of 1.1 or greater for the Undervalued and .9 or less for the Overvalued.
With the benefit of our current data set of 7 years of data (46,000 records), and the ability to analyze it using Excel Pivot Tables, it is easy to see which assumptions were correct and which were not.
Payback: We could find little advantage or disadvantage in the 7 years of data in using Payback rank as a criteria. This suggests that the market assignment of a Payback is “efficient”.
Value Line Timeliness: This criteria significantly detracted from the Undervalued performance but proved to be of value in improving the negative results for the overvalued screen (quite dramatically).
As shown at the very top in the 7 years graph and tables of results, what worked as hypothesized were VR and EST/MPEPS: the spread between Undervalued and Overvalued screens was 9.2% annually
.
Therefore we would argue that the result presented are substantially derived in real time.
.
Therefore we would argue that the result presented are substantially derived in real time.
Tuesday, November 15, 2011
Performance Results: 7 years September '04 to September '11
The Undervalued Screens outperformed the Overvalued by 9.2% per annum for the 7 years ending in September.*

Relative to our universe, the annualized returns were +3.2% pa vs -5.8% p.a. respectively. Relative to the S&P 500. the returns were +5.9% and -3.3% for the seven year period.
Performance data for other periods ending Sept 30th are show in the table below:

$100 invested in the both was would have been worth $150 and $79 respectively. Using only the top and bottom quartile for VR and E/M (4,4 vs 1,1) we get even larger returns and divergence. The values after seven years becomes $166 vs $68. The former screens would be closer to a portfolio returns while the latter are the buy & and sell or short lists.
* Returns are for the top bottom 2 quartiles for Valuation Return/Risk (VR) and the top and bottom quartile for E/M (the ratio of estimated earnings (EST) divided by normalized earnings (MPEPS)). Returns exclude income and are based on linked monthly average gains or losses.

Some background ...
In the late 1960s Robert co-founded Marcinvest Fund, a no load equity mutual fund in Canada. As manager, he developed a valuation methodology to ascertain whether street expectations were already discounted in the stock prices. In the early seventies Marcinvest was merged with Altimira Management and Robert continued as the sole equity manager.
In 1976, he moved to Boston to sell an institutional equity valuation service (under Colby Equity Valuations, Inc.). The valuation model was computerized in order to cover a large number of equities. Its primary goal is in identifying overvalued and undervalued equities.
The institutional clients who subscribed to the service included Allied Signal, Canadian Pacific, Canadian Broadcasting, General Electric, Ontario Hospital Association and Ontario Municipal Retirement System, Choate Hall & Stewart, Fidelity International, Fiduciary Trust Company, The First Church of Christ Scientist, Gardner & Preston Moss, Harvard Management Corporation, Jarislowsky Fraser, Massachusetts Financial Services, Thorne Ernst & Whinney, United Financial Management and Wellington Management. In addition, Robert was President of Manasset Corporation, a family office in Providence, RI. Mr. Colby’s equity valuation service was re-started over 7 years ago.
Robert Colby has had extensive corporate Board experience both as board member and officer of a number of for profit and non-profit organizations. A graduate of McGill University, he maintains residences in Dedham, Ma and Georgeville, Quebec.
Thursday, April 14, 2011
Long term bond yield of 6.3% needed to erase valuation disparity with equities
Last weekend, the Wall Street Journal carried an interesting article on the current valuation of the S&P 500.
http://blogs.wsj.com/marketbeat/2011/03/11/give-it-to-me-straight-are-stocks-cheap-or-not/?KEYWORDS=Shiller#
In it, Professor Robert Shiller argues that the index is overvalued based on its current P/E ratio using a 10 year moving average of earnings.
However, looking at the value relationship between equities and long term bonds, we reached a very different conclusion: Equities are significantly undervalued compared to bonds despite the rise in equity prices over the last two years.. The extraordinary low long term rate today might justify some or all of what Prof Shiller's observes, i.e. at a 3.46% yield, long term bonds have a p/e of close to 30x.
Using the Corequity valuation model, we can measure how much prices would have to change to be back in a more balanced value relationship.
First, we normalize the the Long Term yield, using the data that Prof. Shiller kindly makes available on the their website and referred to in the article.

The next step is to show the history of relative valuation (Payback) of long term bonds vs equities.

This shows that there had been a period of relative stability in this relationship in the late '80s and 90's which was followed by a rise in relative valuation of bonds as rates continue their secular decline.
Assuming that the earlier period is a reasonable standard of value, we would expect bonds to be between 100 and 200 percent of the S&P 500 payback. Using this range, the following chart shows the calculated prices compared to the High, Low and Closing prices for long term bonds.

To be fairly valued in this relationship, bonds would have to decline about 45% to yield 6.30%, up substantially from the current 3.46%. More likely, the correction would take place with stocks rising as bond prices fall.
Robert L .Colby
December 31st 2010 Undervalued and Overvalued lists - update
The Undervalued Screen from last December is up 7.2% while the Overvalued is -0.3%. Given that the S&P 500 is up 4.2%, the relative performance numbers are +3.0% and -4.5 respectively. These numbers are very large for the period in question.
The Undervalued list shown here had positive contributions from the Consumer Goods, Healthcare and Oil & Gas Sectors.

The Undervalued list shown here had positive contributions from the Consumer Goods, Healthcare and Oil & Gas Sectors.

Wednesday, March 30, 2011
Industry Valuations as of March 29th 2011
This table has the average equity valuation results for all industries where there was more than one company represented (see Count column). Other column headings that need explanation are VR for Valuation Return or Risk, RR for Growth, PB for Payback in years, EST/MPEPS is the ratio of estimated EPS vs normalized EPS (MPEPS) and the average Value Line Timeliness Rank.
 |
| Alphabetic sort |
The same table sorted by Valuation Return/Risk
 |
| Sorted by VR |
Using Valuation Return/Risk as a proxy for future relative performance, the following characteristics are associated with a positive outlook: high RR or growth, low Payback and a favorable (i.e. low) Timeliness Rank from Value Line.


Tuesday, March 29, 2011
Corequity Valuation Model Results
Corequity is an equity valuation model which takes into account the normalized earnings, the derived reinvestment return plus yield, and the history of relative valuation to project a Valuation return or risk as a percentage change in price.
The current universe is just over 500 publicly traded US equities.
This equity universe has been valued monthly for over 6 years and the results were screened for the best and worst values. Their relative performance in the subsequent month was calculated and their indices are shown below.*

The average Undervalued stock has outperformed our universe by 468 basis points per annum while the Overvalued average underperformed by 340 basis points pa. The resulting spread is 8.1% per annum in favor of the Undervalued over the 6 1/4 year period.
Even more pronounced, a subset of the Overvalued (comprising of 25% of the total) underperformed the universe by 1251 basis points per annum. In absolute terms, $1,000 invested in this group is worth $378 after 6 ¼ years suggesting a particularly good source of short candidates.
* Screens are based on top and bottom quartiles of E/M (Estimate/MPEPS, or smoothed earnings) and top and bottom two quartiles of VR, Valuation Return or Risk.
Monday, March 7, 2011

Sunday, March 6, 2011
December 31st 2010 Undervalued and Overvalued lists
Our screens are working in this market as evidenced by these two short lists taken from the year end screens. The equities in UVEPS and OVEPS are a subset of the larger valuation screens by virtue of their favorable and unfavorable rating by a third party. The spread between the two in just over 2 months is 10% in favor of the undervalued list.
This is a Porfolio Map of the UVEPS list which is up 10.9% so far this year.

Their opposite screen OVEPS is up only .3% while the S&P 500 is up 5.0%.

Please note that the color screen is not quite equivalent but close. The color scales which reflect price change are close but not exact.
Robert L. Colby
Subscribe to:
Posts (Atom)