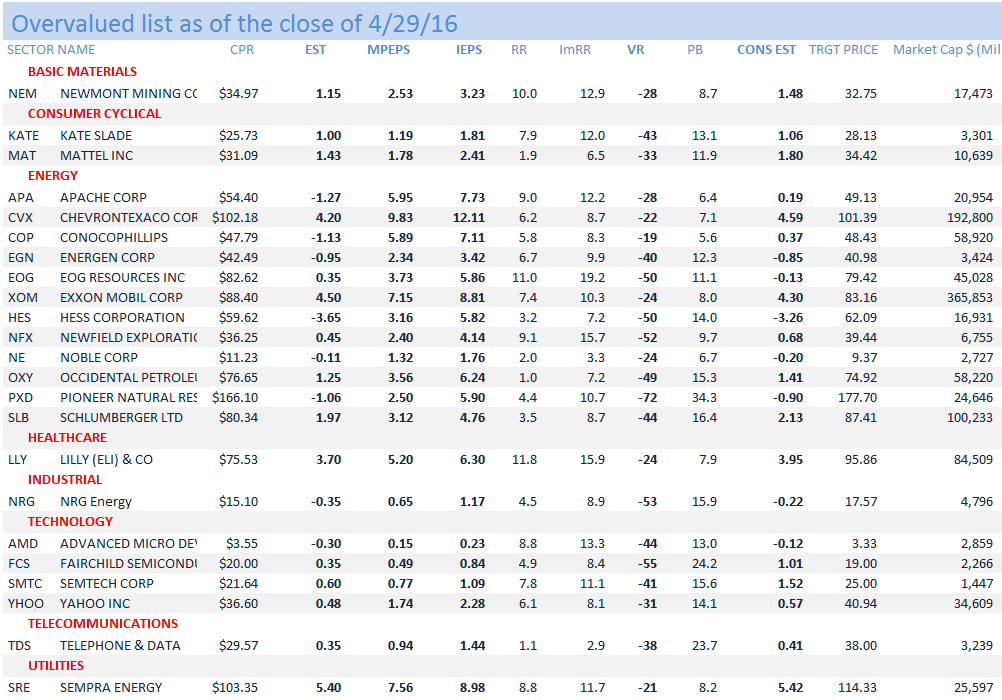
Corequity provides independent, institutional equity valuation research. The results are used to screen for the best and worst values out of over 500 equities on a continuous basis. We have accumulated a proprietary database of historical monthly valuation data. For a brief background... http://corequity.blogspot.com/2013/05/some-background.html
Our Net Profit Test:
Comparing Buybacks to Investment shows that a company’s purchase of its own
shares causes a single increase in EPS (as in simple interest) compared to
compounding growth that results from investment. This graph shows the annualized returns of
the two asset allocation decisions over time. The sinking annualized return on a buyback explain the relatively low level of return required to grow the Net Profit at the rate that the buybacks achieved due to the fewer number of shares.
(See “Net Profit Test:
Comparing Buybacks to Investment” at corequity.blogspot.com)
The sinking annualized return on a buyback explains the relatively low level of return required to grow the Net Profit at the same rate that a buyback achieves due to the fewer number of shares.
To illustrate the advantage of Investment over Buybacks, here
are two very similar companies who couldn’t be further apart in their asset allocation
choices. The two are Cracker Barrel
(CBRL) and Jack in the Box (JACK). They
are both mid-cap Restaurant companies trading at 19x earnings.
CBRL’s Cash
Flow from Operations less Dividends totaled $1.27 billion from 2008 and
2015. Most of this was invested in its
operations as indicated by its book value per share which grew from $4.15 to $22.45.
As a result of this investment, their Net Profit growth equaled the growth in EPS
over the 7 years (+14.0% vs +13.6%) as their shares outstanding increased
slightly.
By contrast, JACK bought $1.2 billion of their own stock,
reducing their shares outstanding by 37%. As a result their EPS grew by 6.0% pa
entirely due to buybacks but their Net Profit actually declined by 3.7%, or -0.5%
pa.
The Shareholders of JACK today would have been much better
off had management invested those funds - as much as that may have made the Sharesellers
happy. The company would only have to earn
a 4.8% return on those funds for the Net Profit to match the “growth” in EPS (the
Net Profit Test). That would have
generated $64 million more in Net Profit in 2015 alone, or 56% more than they actually
achieved ($178 million vs $115).
Much has been said about the role of share buybacks in
executive stock options. It is therefore
interesting to note how much these two companies compensated their senior
management. In 2015, Jack in the Box led
by $16.6 to $13.8 million[2]. The five year average number is closer but
JACK still wins: $9.9 to $9.6 million.
In JACK’s case, management is clearly not being judged by
the Net Profit Test.
I have been convinced that the ETF funds exercise a significant influence on equity valuations and your recent column on low volatility stocks gave me an opportunity to prove it - to my satisfaction anyway.
The first graph is the dollar volume for the large ETF, iShares MSCI USA Minimum Volatility (USMV) showing a clear run-up that you described. (Yahoo Finance: Monthly, $ millions.)
This chart below shows the relative performance of 50 of the larger stock holdings in the USMV. The index is the relative performance of these stocks compared to the average of our universe of close to 500 equities. It shows a gain of 25% from the low in the summer of 2014.
Finally, this is the average Valuation Return/Risk (VR) of these stocks, again relative to our universe. From a high of +5% in early 2014, the average Risk is now -15%. (VR is the projected price change between the current price and the price at which it would equal its inherent value)
My theory is that purchasing ETFs does not involve valuation analysis as individual stock selection would and it appeals to Momentum buyers. As such it becomes a source of inefficiency in equity pricing.
Thirty equities
with significant buyback programs in the last 7 years show that their average EPS
grew at 9.9% pa while Net Profit gained only 4.9% (Median numbers are 8.1 vs
1.7%.) Using the averages, the give up is 5.0% pa which is an enormous
difference in the amount of cash generated.
Our analysis
is based on the Net Profit Test which asks the question: what rate of return is required on investing the
buyback funds to grow the Net Profit and EPS at the same rate as the Earnings per Share (EPS) grew due to the buyback. The
answer is not very much. The average for
the 30 stocks is 5.8% and the median 5.4%.
This give up
in Net Profit is directly attributable to the size of the buyback program as
shown in this chart. On the x-axis we
have the size of the reduction in shares outstanding from 2008 to 2015. On the y-axis, we show the give up in the
growth of EPS and Net Profit. The
correlation between the two is 0.94. In
plain English, the larger the buyback program, the greater the penalty as
measured by cash generation.
There are two main reasons for this apparent anomaly. One, the price paid for the shares is too much to compete with alternative investments (the average P/E for all stocks is 15x for the period). An example of this is given in the paper “The Net Profit Test: Comparing Buybacks to Investment”. Secondly, the correlation between each equities annual percentage of total buyback and average annual price is very a positive: it averages 0 .48 and the median is 0.59. The exceptions are ANTM (-0.60), CSCO (-0.03), GPS (-0.33), TMK (-0.12) AND TRV (-0.16).
Ranked from the bottom in terms of Required Return to equal EPS growth we have BOBE (-0.7%), MCD (2.3%), LM (2.9%), KO (3.7%), DRI (3.8%), KMB (2.9%), VAR (4.3%), FOSL (4.3%), CAKE (4.5%), OMC (4.8%), AAPL (5.0%), ALL (5.1%), TXN (5.1%), PH (5.2%), SHW (5.3%) and DE at 5.4%.
Correl
is the Correlation between average stock
price and the %age of annual buyback to total buyback from 2009 to 2015. There is a definite positive correlation
between the size of the annual buyback and the price.
Shares
O/S
is the %age contraction from 2008 to 2015
Cost
(B$)
is the cost in Billions of total shares bought back from 2009 to 2015
%
Growth
in EPS and NET PRF is the % annual growth in Earnings per Share and Net
Profit from 2008 to 2015
Give
up
is the difference between the growth in EPS and growth in Net Profit.
Required
Return ADJ and NOM. The nominal required return is the % growth
applied to the buyback cost to equalize the growth in net profit to earnings
per share growth. ADJ is the adjusted
required return to reflect that our method of calculation of buyback cost is less than actual cost (using last 4 years
of data)
Average
Prc/Bk (Price/Book Value) and Ave P/E (Average Price to Earnings
ratio) are based on 2009-2015
The Net Profit Test asks the question: what rate of
return is required on investing the buyback funds to grow the Net Profit at the
same rate as the Earnings per
Share (EPS) grew due to the buyback. If it can be shown that a low rate of return would
equalize the growth between Net Profit and EPS, then the probability is high
that the company would earn more money by investing.
The return that a
shareholder receives when a company buys back its stock occurs at the time of
purchase and only then. It is because the Net Profit is being divided by a
fewer number of shares (i.e. decimating the denominator).This is contrasted to investing the same
funds (i.e. enhancing the numerator).
In this example,
the company is assumed to have bought back 10% of its shares at 10x earnings.
With 10% fewer shares, the EPS is increased by 11% at the outset.
The alternative use of the buyback funds
is assumed to be an investment that earns 3% in the first year, 8% the
second and 10% thereafter. As shown in the graph, the annualized
returns crossover occurs in the second year and from that point on the investment
is the better asset allocation decision.
Surprisingly, the return
generated by buybacks is independent of the price paid for the shares. Instead,
the cost of the decision is measured by what the funds could otherwise have
achieved if invested. In the above example, if the buyback was done at $7.20 a share, the Net Profit under the two scenarioswould be equal after 8 years. However,
with the buyback at $10.00, the investment would have generated 40% more
in Net Profit.
(As a corollary, the higher the investment
return, the lower the buyback price that can be justified.)
Our analysis of 25
companies with aggressive buyback programs from 2008 to 2015 shows an average P/E
of 15x earnings. It is also evident that
most companies spend more on buybacks when their P/E’s are at the upper end of
their range suggesting a higher dollar weighted P/E.
My conclusion is
that few buybacks in recent years come even close to meeting the Net
Profit Test. Given that S&P 500 companies alone have bought back over $2
trillion of their stock since 2009, you have to be in awe by the scope of
this misallocation of corporate assets and its consequences for the economy.
Robert, I read with
great interest your recent blog post demonstrating the relatively low ROI's
required to replicate EPS growth from equivalent share buybacks.
Your analysis suggests profound flaws in the two most common rationales
corporate executives give for their share buyback programs
1.Our actions reward
shareholders by making their shares more valuable
2.Our stock is
undervalued. Our actions reflect management's confidence in our growth
potential
The first argument may
be true for EPS, but not for long term stock price appreciation. The second
argument is even more galling, as your analysis suggests exactly the
opposite. Given your results, the only logical explanation to go ahead
with an aggressive buyback program is that management actually doesn't
believe it can generate even modest returns on its cash from current
operations. Or said another way, management is in essence saying they are
giving money back to shareholders because they have run out of ideas on how to
generate attractive returns within the company. Or course, the more
likely explanation for share buybacks is management bonus kickers based
on EPS. So much for CEO's and boards acting in the best interest of
shareholders.
I teach business
strategy in the MBA program at Columbia Business school where I share a
perspective that effective capital allocation is one of the most important
responsibilities of the CEO. To illustrate the point, I point to IBM who
has skewed its use of capital (including debt financing) towards share buybacks
at the expense of value-creating investments in R&D and capex. As a
result, IBM's R&D lags its technology peers, and not surprisingly (despite
aggressive acquisition activity), its revenues have declined for 15 straight
quarters. The attached figure graphically depicts these trends.
HP is another case of
the folly of favoring share buybacks over R&D in the tech industry.
Carly Fiorina is often criticized for her disastrous acquisition of Compaq, but
her successor Mark Hurd also deserves notoriety for slashing HP's R&D
expenditures while sizably expanding HP's share buyback program.
Shareholders who
maintained their investments in both of these companies through their periods
of substantial share buybacks have not fared well.
I'd be curious to
learn whether you've done any analysis tracing the stock price performance
(relative to the S&P 500) of companies who have been most active in stock
buybacks. Has management unwittingly practiced buy high/sell low?!
Marissa Mayer, chief executive of Yahoo.CreditRamin Rahimian for The New York Times
It is one of the great investment conundrums of our time: Why do so many stockholders cheer when a company announces that it’s buying back shares?
Stated simply, repurchase programs can be hazardous to a company’s long-term financial health and often signal a management that has run out of better ways to invest in the business.
And yet investors love them.
Not all stock repurchases are bad, of course. But given the enormous popularity of buybacks nowadays, those that are harmful probably outnumber the beneficial.
Those who run companies like buybacks because they make their earnings look better on a per-share basis. When fewer shares are outstanding, each one technically earns more.
But a company’s overall profit growth is unaffected by share buybacks. And comparing increases in earnings per share with real profit growth reveals the impact that buybacks have on that particular measure. Call it the buyback mirage.
Consider Yahoo. The company bought back shares worth $6.6 billion from 2008 to 2014, according to Robert L. Colby, a retired investment professional and developer of Corequity, an equity valuation service used by institutional investors. These purchases helped increase Yahoo’s earnings per share about 16 percent annually, on average.
But a good bit of that performance was the buyback mirage. Growth in Yahoo’s overall net profits came in at about 11 percent annually.
Given these figures, Mr. Colby reckoned that Yahoo, if it had invested that same amount of money in its operations, would have had to generate only a 3.2 percent after-tax return to produce overall net profit growth of 16 percent annually over those years.
Some companies argue that the money they spend repurchasing stock is a shrewd use of their capital. And given Yahoo’s track record in recent years, its management team seems to have had a hard time identifying profitable investments.
But Mr. Colby pointed out that buybacks provide only a one-time benefit, while smart investments in a company’s operations can generate years of gains.
Yahoo declined to comment on its buybacks.
This analysis may be of interest to Starboard Value, an activist investor that is a large and unhappy Yahoo shareholder. On Thursday, Starboard nominated nine directors to replace the company’s entire board, saying its current members lack “the leadership, objectivity and perspective needed to make decisions that are in the best interests of shareholders.”
In a statement, Yahoo said, “The board’s nominating and governance committee will review Starboard’s proposed director nominees and respond in due course.”
Yahoo is not alone. Mr. Colby conducted a cost-benefit analysis of 26 companies buying back stock versus using that money to invest in a business.
He found that McDonald’s was another problematic example. Since 2008, McDonald’s has allocated almost $18 billion to buybacks. This has helped produce 4.4 percent increases in annual earnings per share over the period. To equal that growth in overall earnings, the company would have had to generate just a 2.3 percent return on the money it spent buying back stock, Mr. Colby estimated.
Last November, Moody’s Investors Service downgraded McDonald’s unsecured debt rating, citing its plans to increase its borrowings in part to fund future buybacks.
Becca Hary, a McDonald’s spokeswoman, said the company had a “balanced and disciplined capital-allocation strategy that promotes long-term value for our shareholders.” She cited McDonald’s plans to invest $2 billion to open a thousand new restaurants and “to reimage 400 to 500 locations” domestically.
In an interview, Mr. Colby said his research “confirms my suspicion that while buybacks are not universally bad, they are being practiced far more broadly and without as much analysis as there should be.”
Perhaps the crucial flaw in buybacks is that they reward sellers of a company’s stock over its long-term holders. That’s because a company announcing a repurchase program usually sees its stock price pop in the short term. But passive investors, such as index funds, and other long-term holders gain little from the programs.
Especially problematic are buybacks financed with borrowed money; repurchases of stock made at prices above its intrinsic value are also unwise.
Another hazard: companies that spend billions to repurchase stock without substantially shrinking the number of shares outstanding. That’s because in these circumstances, prized corporate cash is used to buy back shares that offset stock grants bestowed on company executives in rich compensation plans.
And there are plenty of companies whose buybacks have simply left them with less money to invest in more promising opportunities.
“By throwing away money on buybacks, companies are giving up on the ability to grow in the future,” said Michael Lebowitz, an investment consultant and macrostrategist at 720 Global in Chevy Chase, Md.
At last, some investors are stirring on this issue. Domini Funds, a mutual fund company, and the A.F.L.-C.I.O.’s investment funds have submitted shareholder resolutions on share buybacks at 3M, Illinois Tool Works, Target and Xerox this year.
The proposals ask the companies to adopt a policy of excluding the effect of stock buybacks from any performance metrics they use to determineexecutive pay packages.
“We’re not against buybacks,” said Adam M. Kanzer, a managing director at Domini. “The question is at what point do buybacks become excessive and when do they undermine the long-term value of the company?”
At 3M, for example, research and development expenditures plus strategic acquisitions have totaled $22 billion over the last five years, Mr. Kanzer said. In the meantime, the company’s buyback program has cost $21 billion.
“When the buyback almost equals all the other expenditures, it makes sense to ask questions about whether there’s a more constructive way to invest that capital,” Mr. Kanzer said.
Asked about these questions, Lori Anderson, a 3M spokeswoman, referred me to the company’s proxy filing, which stated, “We believe these concerns are unfounded, as demonstrated by our long-term track record and our balanced capital-allocation approach.”
A group of institutional investors will also convene soon to examine the pros and cons of buybacks. The Shareholder Forum, which conducts independent programs to provide information that helps investors make sound decisions, is starting a new program on the topic.
“You really have to ask why a company’s board decides to return a big chunk of capital instead of replacing managers with ones who can figure out how to develop the operations,” said Gary Lutin, who oversees the Shareholder Forum.
“If the board doesn’t think it’s worth investing in the company’s future,” Mr. Lutin added, “how can a shareholder justify continuing to hold the stock, or voting for directors who’ve given up?”